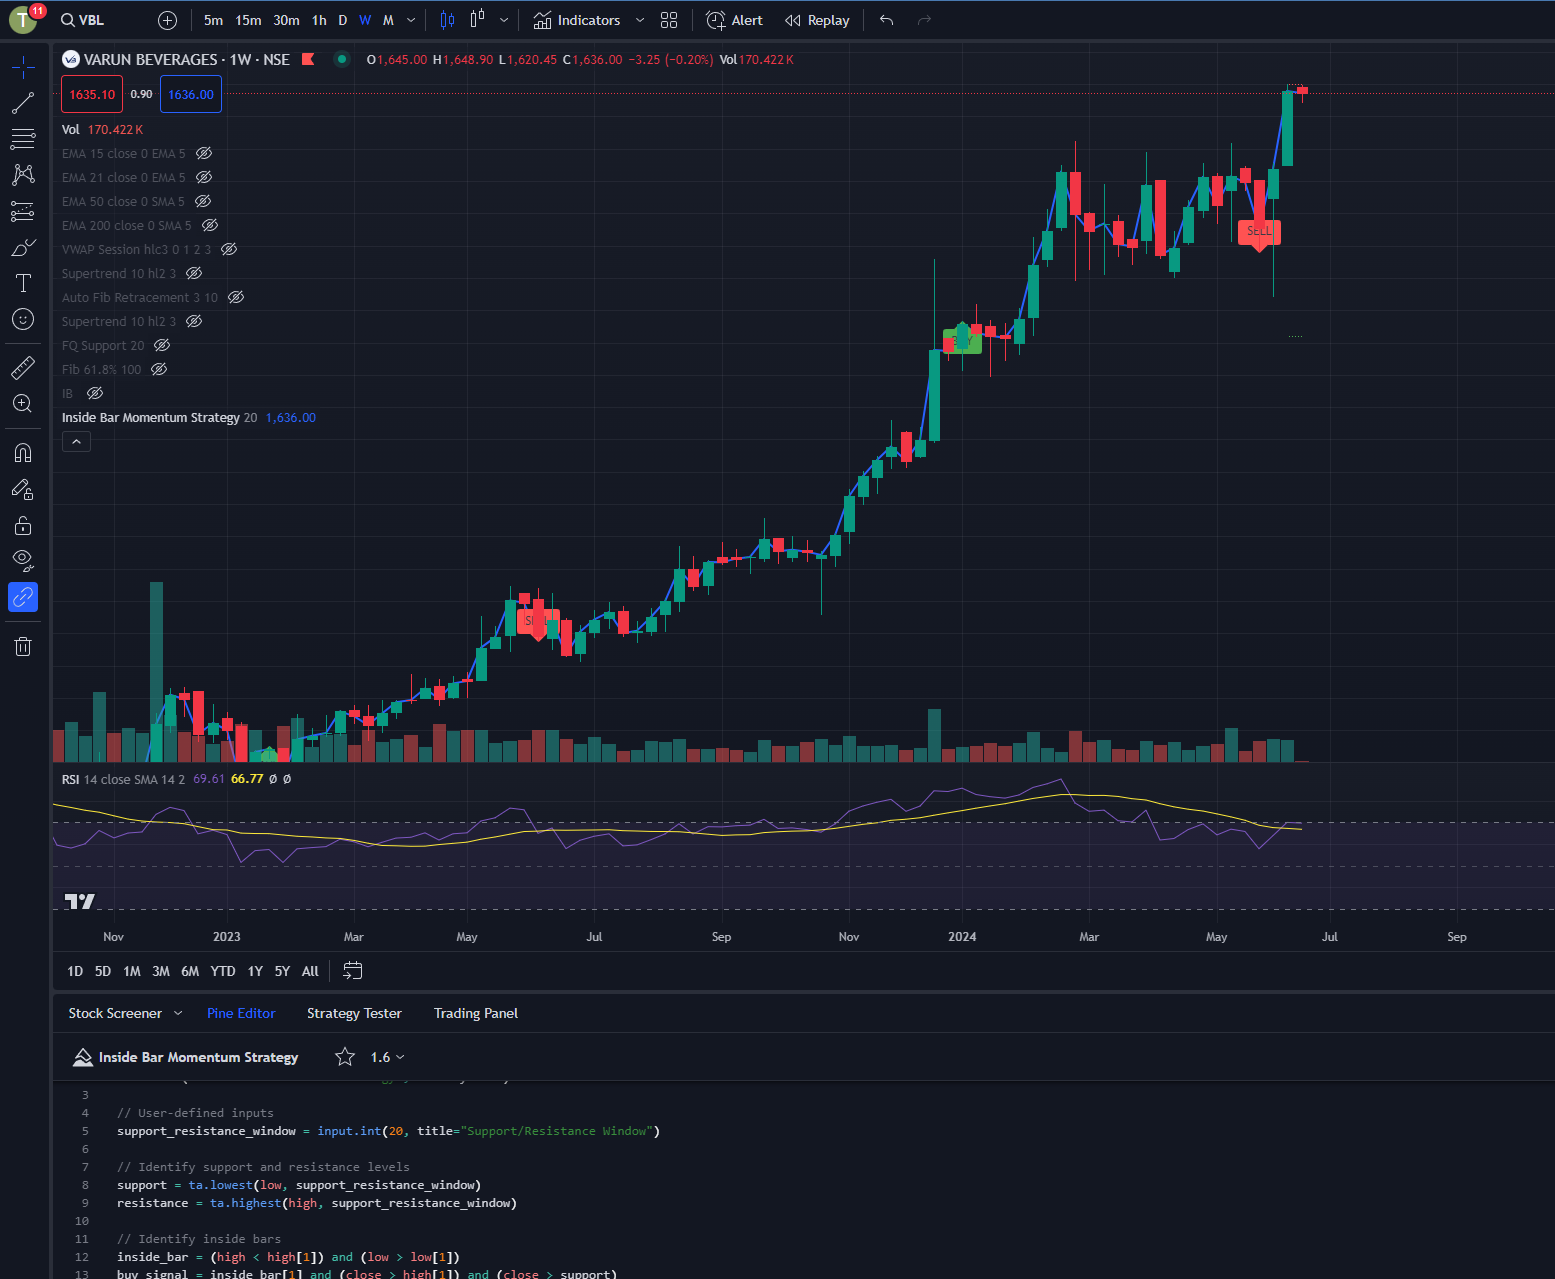
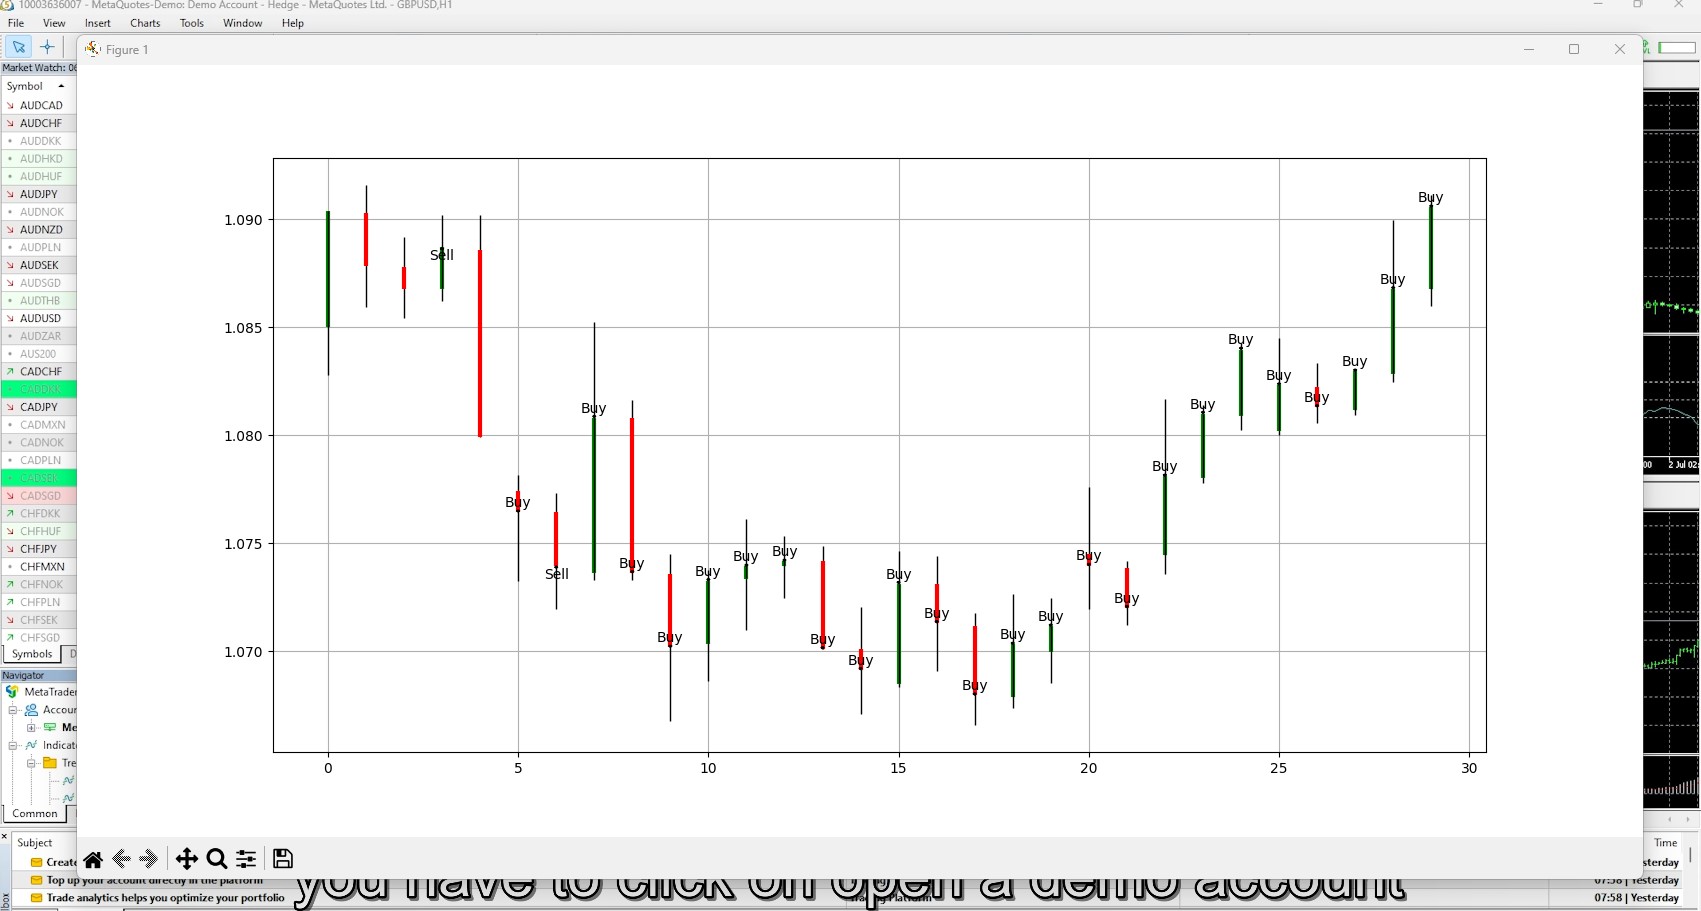
This script identifies buy and sell opportunities based on inside bar patterns and ensures that no consecutive buy or sell signals are generated. The signals are then plotted on the chart along with the support and resistance levels.
- Indicator Initialization:
- The script is set to Pine Script version 5 and defines an indicator called “Inside Bar Momentum Strategy” which is overlaid on the price chart.
- User Inputs:
support_resistance_window: A user-defined input to specify the window size for calculating support and resistance levels.
- Support and Resistance Calculation:
- Support: Calculated as the lowest low of the last
support_resistance_windowbars. - Resistance: Calculated as the highest high of the last
support_resistance_windowbars.
- Support: Calculated as the lowest low of the last
- Inside Bar Identification:
- An inside bar is identified if the current high is less than the previous high and the current low is greater than the previous low.
- Buy and Sell Signal Generation:
- Buy Signal: Generated if the previous bar is an inside bar, the current close is greater than the previous high, and the current close is above the support level.
- Sell Signal: Generated if the previous bar is an inside bar, the current close is less than the previous low, and the current close is below the resistance level.
- Signal Filtering:
- Consecutive buy or sell signals are prevented by using a variable
last_signalto track the type of the last signal. - A buy signal is generated only if the last signal was not a buy.
- A sell signal is generated only if the last signal was not a sell.
- Consecutive buy or sell signals are prevented by using a variable
- Position Tracking:
- A variable
in_positiontracks whether a buy position is currently open. - When a buy signal is generated,
in_positionis set totrueand theentry_priceis updated. - When a sell signal is generated,
in_positionis set tofalseand theentry_priceis reset.
- A variable
- Plotting:
- The close price is plotted on the chart.
- “BUY” and “SELL” labels are added at the points where buy and sell signals are generated.
- Dynamic lines for support and resistance levels are drawn and updated at each bar.
//@version=5
indicator("Inside Bar Momentum Strategy", overlay=true)

// User-defined inputs
support_resistance_window = input.int(20, title="Support/Resistance Window")

// Identify support and resistance levels
support = ta.lowest(low, support_resistance_window)
resistance = ta.highest(high, support_resistance_window)

// Identify inside bars
inside_bar = (high < high[1]) and (low > low[1])
buy_signal = inside_bar[1] and (close > high[1]) and (close > support)
sell_signal = inside_bar[1] and (close < low[1]) and (close < resistance)

// Variables to track the entry price and position status
var float entry_price = na
var bool in_position = false  // Track if we are in a buy position
var string last_signal = na  // Track the last signal

// Process each bar
if buy_signal and not in_position and (last_signal != "buy")
    entry_price := close
    in_position := true
    last_signal := "buy"
    label.new(bar_index, high, "BUY", style=label.style_label_up, color=color.green)

if sell_signal and in_position and (last_signal != "sell")
    in_position := false
    entry_price := na
    last_signal := "sell"
    label.new(bar_index, low, "SELL", style=label.style_label_down, color=color.red)

// Plotting
plot(close, title="Close Price", color=color.blue, linewidth=2)

// Draw dynamic lines for support and resistance
var line support_line = na
var line resistance_line = na

if na(support_line)
    support_line := line.new(x1=bar_index, y1=support, x2=bar_index[1], y2=support, color=color.green, width=1, style=line.style_dotted)
else
    line.set_xy1(support_line, x=bar_index, y=support)
    line.set_xy2(support_line, x=bar_index[1], y=support)

if na(resistance_line)
    resistance_line := line.new(x1=bar_index, y1=resistance, x2=bar_index[1], y2=resistance, color=color.red, width=1, style=line.style_dotted)
else
    line.set_xy1(resistance_line, x=bar_index, y=resistance)
    line.set_xy2(resistance_line, x=bar_index[1], y=resistance)


