//@version=5
indicator("False Breakout Strategy", overlay=true)
// Parameters
window = input.int(14, title="Rolling Window")
reversal_period = input.int(3, title="Reversal Period")
// Rolling high and low
high_rolling = ta.highest(high, window)
low_rolling = ta.lowest(low, window)
// Breakout detection
breakout_high = (high > high_rolling[1])
breakout_low = (low < low_rolling[1])
// False breakout detection
false_breakout_high = breakout_high and (close < high_rolling[1]) and (close > ta.lowest(close[1], reversal_period))
false_breakout_low = breakout_low and (close > low_rolling[1]) and (close < ta.highest(close[1], reversal_period))
// Plot signals
plotshape(series=false_breakout_high, location=location.abovebar, color=color.red, style=shape.labelup, text="False High")
plotshape(series=false_breakout_low, location=location.belowbar, color=color.blue, style=shape.labeldown, text="False Low")
// Optional: Highlight breakouts
plotshape(series=breakout_high, location=location.abovebar, color=color.green, style=shape.triangleup, text="Breakout High")
plotshape(series=breakout_low, location=location.belowbar, color=color.orange, style=shape.triangledown, text="Breakout Low")
// Add legend entries
hline(na, title="False Breakout High", color=color.red)
hline(na, title="False Breakout Low", color=color.blue)
hline(na, title="Breakout High", color=color.green)
hline(na, title="Breakout Low", color=color.orange)
Explanation:
1. Parameters:
– `window`: The rolling window period for calculating the highest high and lowest low.
– `reversal_period`: The period over which to check for reversals to identify false breakouts.
2. Rolling High and Low Calculation:
– `high_rolling` and `low_rolling` calculate the highest high and lowest low over the specified rolling window.
3. Breakout Detection:
– `breakout_high` is true if the current high is greater than the previous rolling high.
– `breakout_low` is true if the current low is less than the previous rolling low.
4. False Breakout Detection:
– `false_breakout_high` is true if there is a breakout above the rolling high, but the close is below the rolling high and within the specified reversal period.
– `false_breakout_low` is true if there is a breakout below the rolling low, but the close is above the rolling low and within the specified reversal period.
5. Plot Signals:
– `plotshape` is used to plot labels on the chart for false breakouts and breakouts.
– Red labels indicate false breakouts on the high side, blue labels indicate false breakouts on the low side.
– Green and orange labels indicate normal breakouts on the high and low sides, respectively.
How to Add Pine Code Script To TradingView:
1. Copy the Code: Copy the above Pine Script code.
2. Paste in Pine Editor: Go to TradingView, open the Pine Editor, and paste the code.
3. Add to Chart: Save the script and add it to your chart.
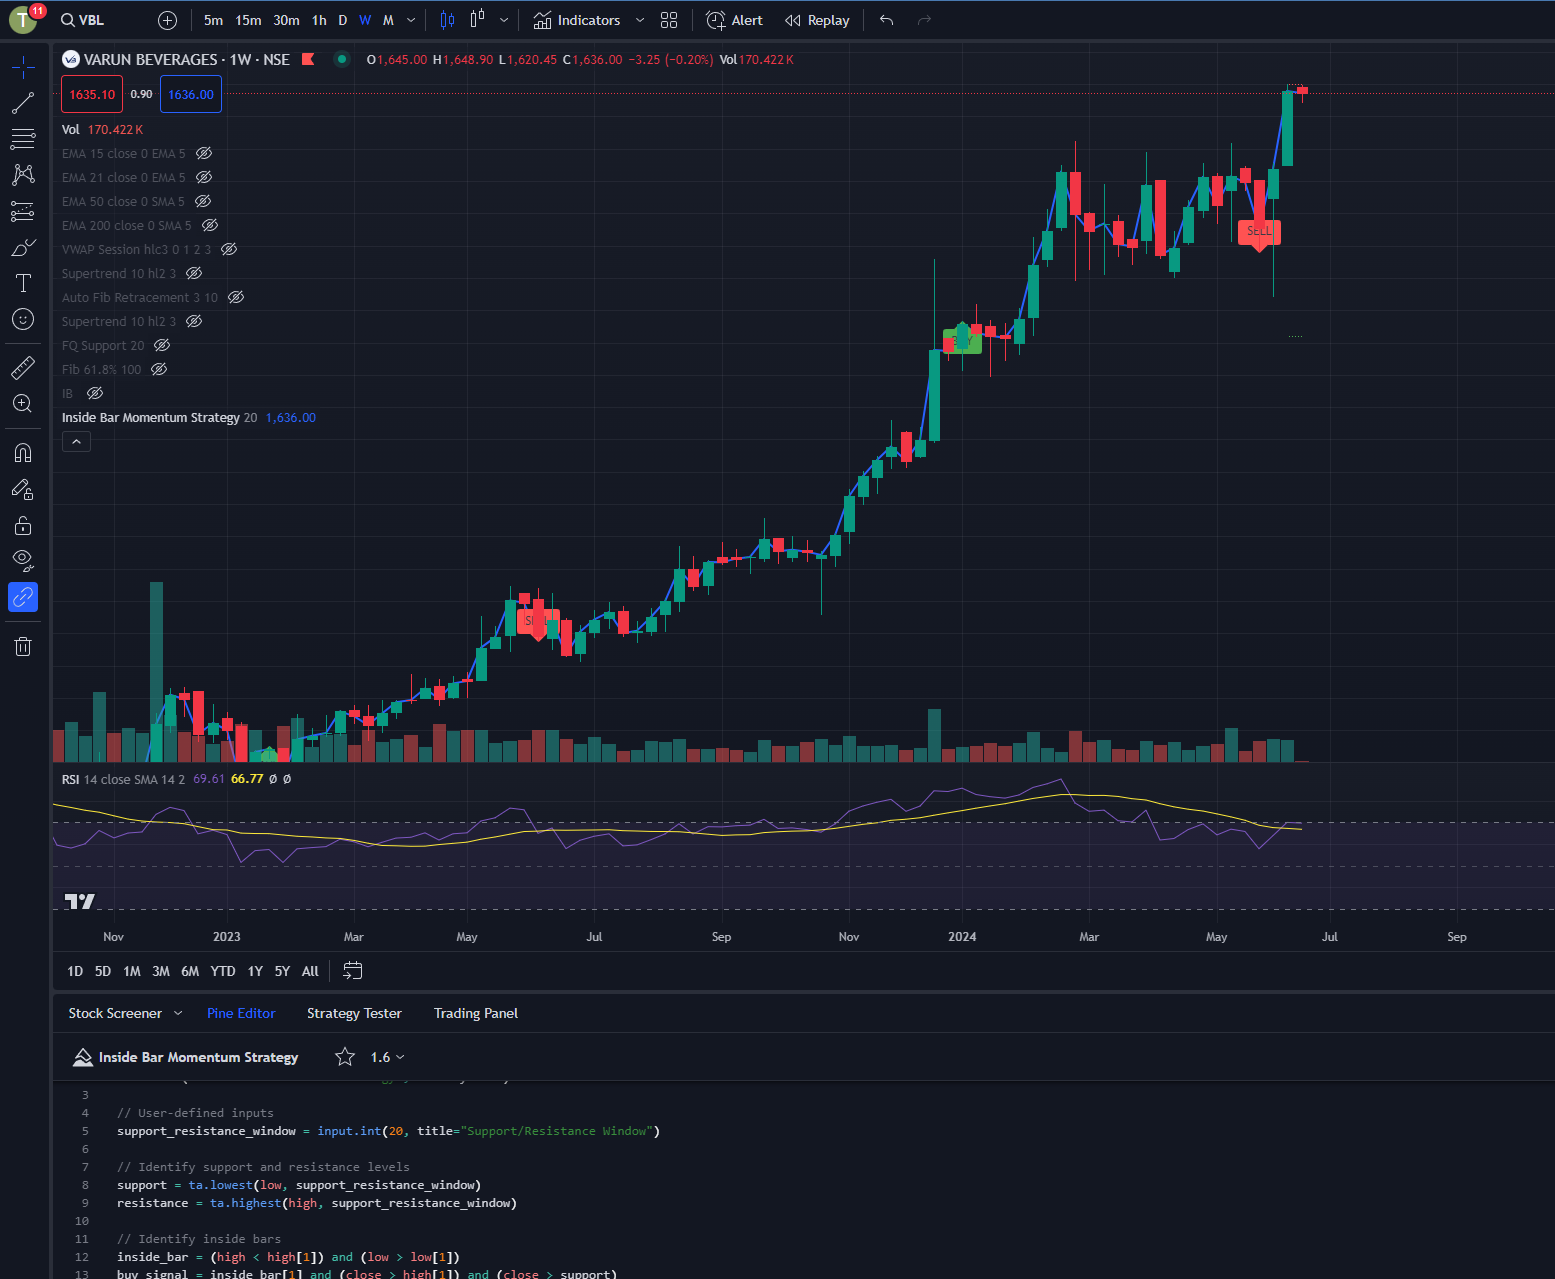
This script will plot labels on your TradingView chart indicating where false breakouts have occurred, helping you to visualize and potentially trade based on these signals. Adjust the parameters as needed to fit your trading strategy.


